Your Developers Can Tell You How AI Feels. Not Whether Delivery Got Faster.
A controlled trial put the gap at 39 points: developers felt 20% faster while measuring 19% slower. The survey samples a feeling, not your delivery system. Here is what to instrument instead.
The board wants one number. Not a story about adoption, not a slide of enthusiastic quotes, one number that answers whether the money spent on AI coding tools is moving delivery. A delivery leader who has rolled out ai developer tools across an engineering org reaches for the obvious source of truth and asks the people doing the work: is AI making you faster? The developers say yes, and most of them say it with conviction. That confident answer is the problem, because it is evidence of how the work felt, not of how the system performed.
Picture the operating review where this surfaces. Copilot is licensed across the team, usage is healthy, a couple of seniors are championing it, and the internal pulse survey says developers feel more productive. Then a CFO renewing the budget, or a board member who has read the same headlines everyone else has, asks the direct version: has any of this shown up in our delivery numbers? Cycle time. Throughput. Defect rates. For most teams the honest answer is that the delivery numbers have not moved in a way anyone can confidently attribute to AI, and the only evidence pointing the other way is the survey. The leader is left defending a program with the weakest possible instrument: a self-report that people feel faster, against system metrics that say nothing changed.
Quick answer: Self-reported developer speed is not evidence of delivery speed. A developer feels the relief of getting started faster, which is genuine, but that feeling is local and immediate while the cost of generated code is distributed and delayed across review, integration, and correction. The fix is not a better survey. Instrument the workflow, roll AI out in a way that preserves a credible comparison group so you can attribute the change, and keep surveys for what they actually measure: the human experience, not delivery speed.
This is not an argument that AI hurts engineering. It is a narrower claim about measurement: the instrument most teams trust for ai developer productivity, the survey, samples the one thing that should not be treated as delivery-speed evidence on this question. What a developer can report is how the work felt. What a board is asking about is how the system performed. Those are different quantities, they can move in opposite directions, and recent controlled evidence shows how far apart they can drift.
Developers Felt 20% Faster and Measured 19% Slower
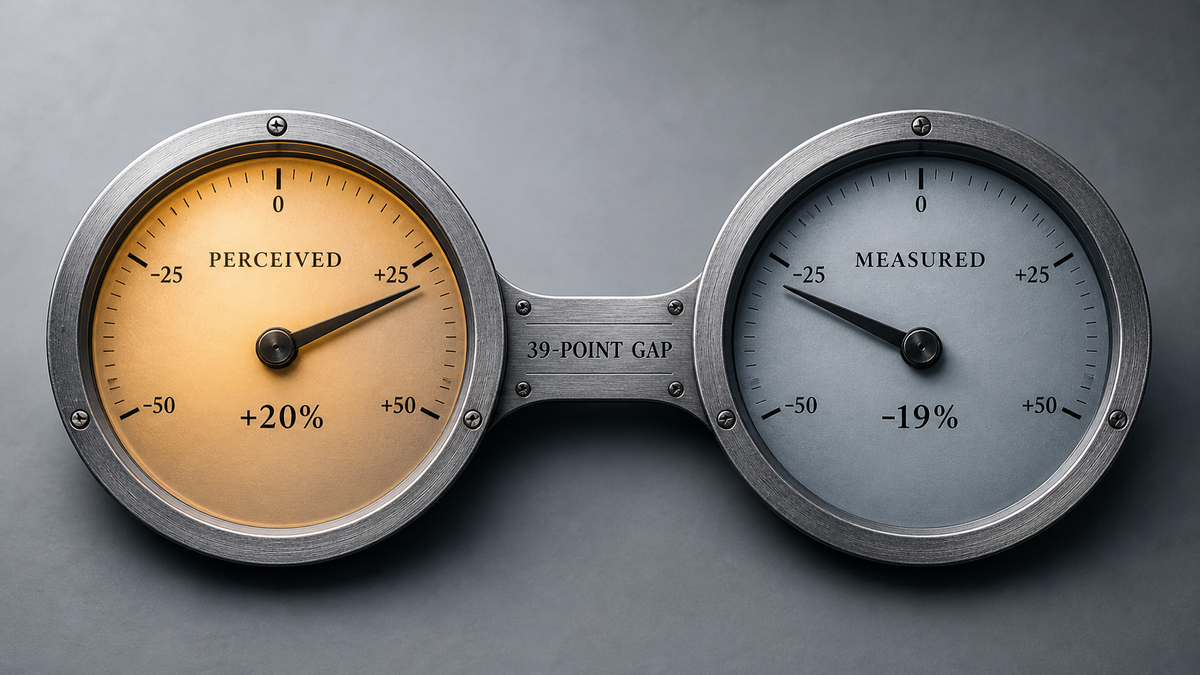
In 2025, the research group METR ran a randomized controlled trial with 16 experienced open-source developers working on repositories they had known for years. The setup is what makes it credible: real tasks on familiar codebases, with each task randomly assigned to allow or disallow AI and completion times measured directly rather than recalled. Before the work, the developers expected AI to speed them up by roughly 20 to 24 percent. After the work, they still believed AI had sped them up by around 20 percent. The measured result was the opposite. On the tasks where they used AI, they were about 19 percent slower.
Hold the two numbers next to each other, because the distance between them is the actual finding. Perception landed near plus 20 percent. Reality landed near minus 19 percent. That is roughly a 39-point gap between how fast the work felt and how fast it measurably went, and it did not close after the developers had done the work and could compare. They had just been slower, and they did not know it. Because each task was completed in only one condition, that 19 percent is an average treatment effect across the randomized task set, not a count of how many individual tasks AI helped or hurt. The average is the claim, and the average went the wrong way.
It would be a misreading to take this as proof that AI makes developers slower, full stop. The result is from a specific population, on specific kinds of tasks, at a specific moment in the tools' maturity, and other settings produce other numbers. The robust part, the part that travels, is not the sign of the speed change. It is the size and direction of the ai productivity perception gap: people inside the work cannot feel their own throughput, and when they guess at it, they guess wrong with confidence. That survives no matter what the speed number turns out to be in your environment.
Why would experienced engineers be so wrong about something they just did? The answer is mechanical.
AI Removes the Friction You Can Feel and Adds the Cost You Cannot
What a developer reports when they say AI made them faster is the part of the work they can feel directly, and the part they can feel is the start. AI removes cold-start friction. The blank file fills in, the boilerplate appears, the half-remembered function signature is suggested before you look it up. The work that used to require pulling structure out of nothing now begins almost immediately. That relief is real, and it is the dominant sensation of the session, so when you ask afterward how it went, the honest report is: faster.
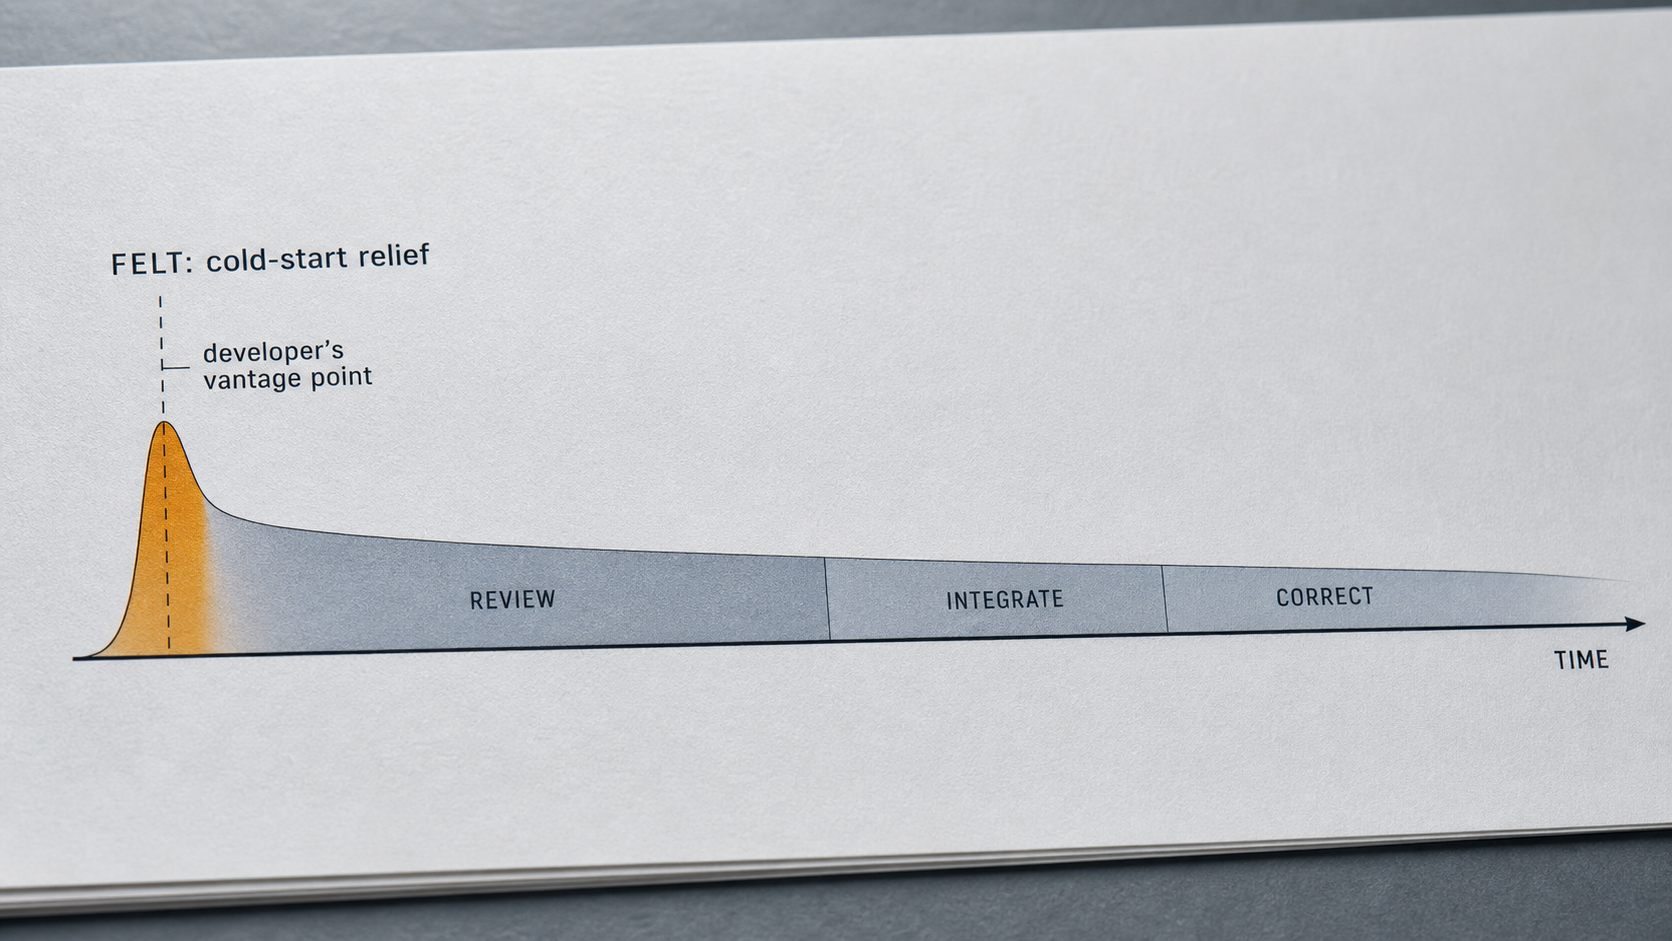
The cost lands somewhere the developer is not standing. Generated code has to be read before it can be trusted, and reading code you did not write tends to be slower and more error-prone than reading your own. Review load rises, in volume and in depth, because the reviewer is now checking work produced by a system that is confidently wrong in unfamiliar ways. Integration takes longer when the generated piece almost fits but not quite, and correction grows as subtle mismatches surface in testing or after merge. None of that registers as "AI made me slower" in the moment, because it is spread across other people and later stages.
This is the likely mechanism behind the self-report illusion: the feeling of speed is local and immediate, while the cost is distributed and delayed. METR's own breakdown is consistent with it. Developers in the trial accepted well under half of the code the AI generated, and spent meaningful time prompting it, waiting on it, and reviewing and correcting its output. One plausible reading is that AI makes the visible part of production feel faster while shifting effort into prompting, verification, and correction, where no single person is positioned to feel the total. The survey question "did AI make you faster" gets answered by the part of the system that sped up, while the part that slowed down has no voice in the response.
A Survey Measures the Feeling, Not the System
A survey is the wrong instrument for this question, and not because the questions are badly worded. It is the wrong instrument because of what it can physically observe. A survey samples a state of mind. It is an excellent tool for learning whether developers like AI tools, whether they trust them, whether morale around the rollout is good. It is structurally incapable of measuring whether the change-review-integrate-correct loop got shorter, because no individual inside that loop can perceive its total length.
This is where measuring ai impact on developers through self-report quietly fails, and one plausible version of the failure compounds: the most enthusiastic adopters, the people most likely to rate the experience highly, may also be the ones generating the most code and therefore the most downstream review and correction load. If so, the signal you most trust is produced by the people creating the cost you most need to see. Github copilot productivity measured as "percent of developers who report a positive experience" can rise while the delivery system underneath slows down, and the survey never shows the contradiction, because it was never looking at the system.
None of this is a case against AI. It is a case against one evidence source. The repair is to change the instrument, and the right instrument already exists in every delivery org. It is just not the survey.
Instrument the Artifacts the Work Leaves Behind
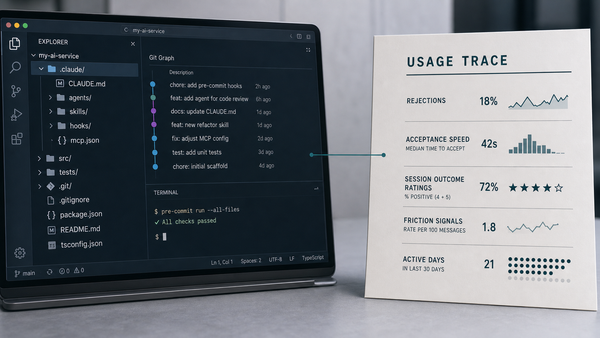
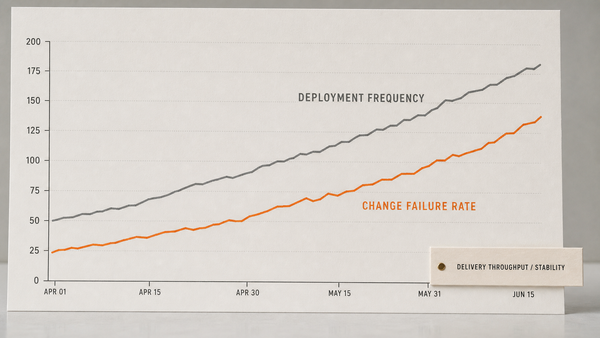
Measure the work the way the work actually changes, which is in the artifacts it leaves behind rather than in the feelings of the people producing them. Start with the signals you can read directly from the delivery system. Cycle time and, more importantly, its distribution: not just the median from first commit to merged-and-deployed, but the shape of the tail, because an average hides whether the easy cases compressed and the hard ones stretched. Review load and review depth, where review depth is how thoroughly each change is actually examined, not just whether it was approved. Reopen rates and escaped defects, the bugs that reach staging or production. Rework share, the proportion of changes revised after they were considered done, which is the clean signal for "we shipped faster and corrected slower."
Then read the artifacts the changed work produces: the specs, the pull request descriptions, the decision logs, the test plans. A team that has absorbed AI into its operating model produces sharper specs and tighter decision records, because the cheap part is now the drafting and the scarce part is the judgment about what to keep. A team that has merely adopted tools produces more text of lower density.
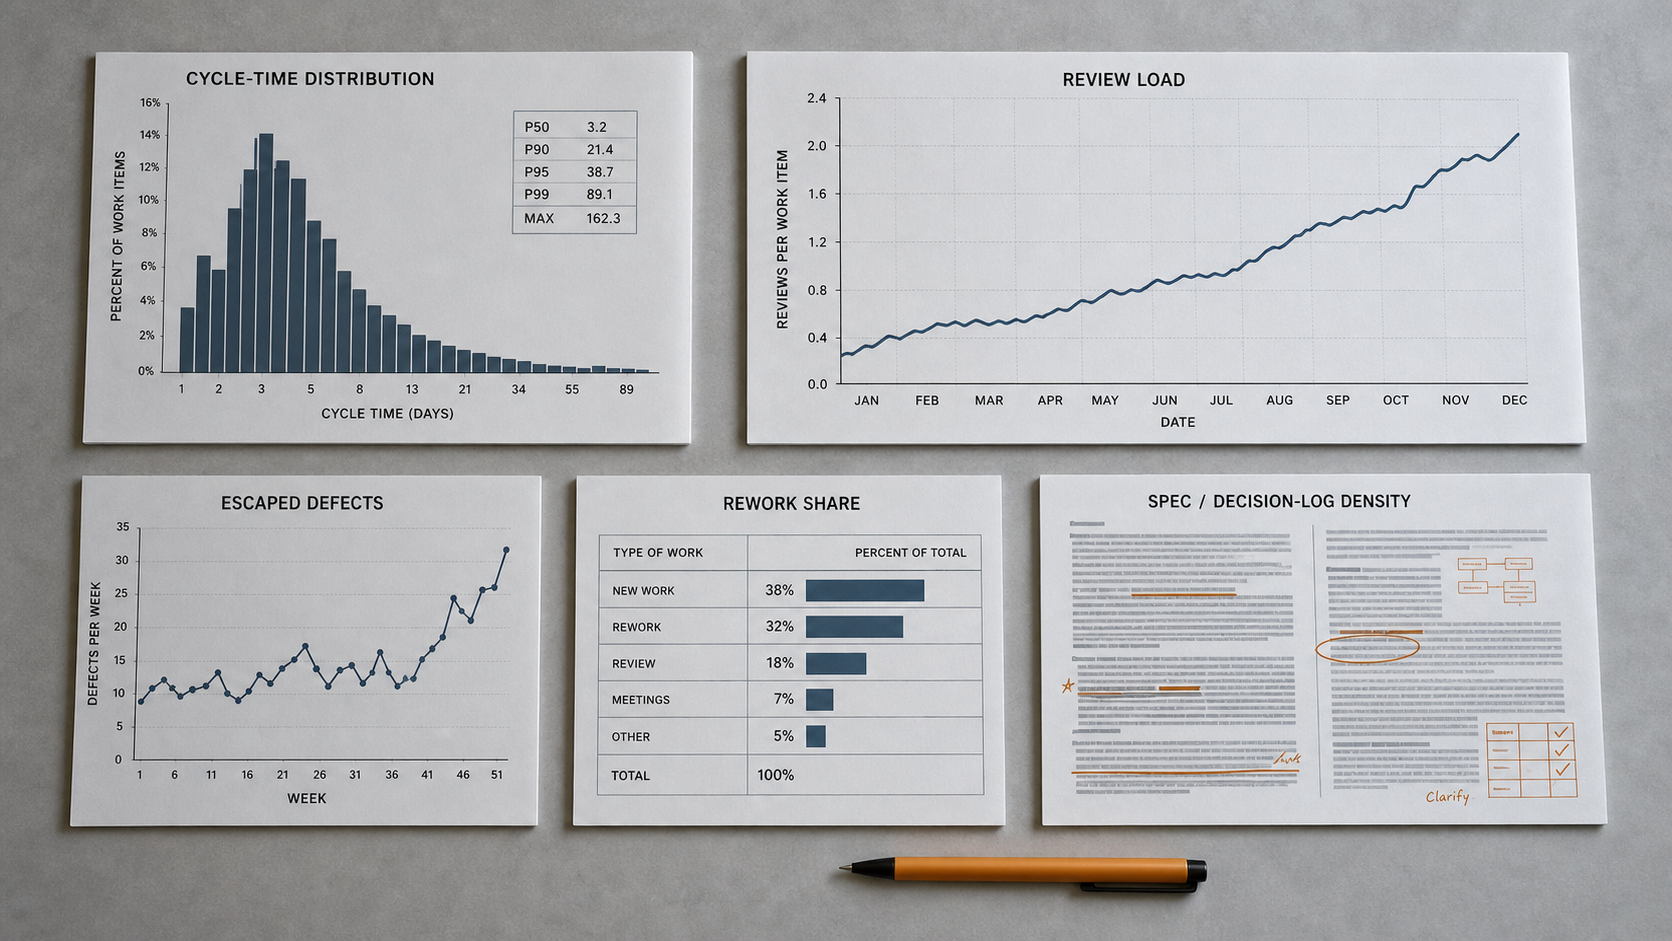
This is ai coding speed measurement done as artifact inspection rather than opinion polling. The principle has a name in the measurement frame I work from, the Shift Harness Artifact Test: you read operating-model change from the evidence the work deposits, not from the self-report of the people doing it. Applied to AI speed claims, the artifact test says "are we faster" is answered by cycle-time distributions, review-load curves, reopen rates, rework share, and the density of specs and decision logs, all of which exist whether or not anyone is asked.
One caution keeps the artifact test honest: artifacts are observable evidence, but they still need interpretation. A shorter pull-request cycle can mean faster delivery or just smaller pull requests. More review comments can mean sharper review or worse code. Fewer reported defects can mean a healthier system or weaker detection. More tests can mean more coverage or more duplication. So the rule is not "surveys lie, artifacts tell the truth." It is narrower: surveys report experience, while workflow artifacts report observable behavior and outcomes, and only the latter can anchor a delivery-performance claim, provided you read it with the failure modes in mind.
Observation Is Not Attribution
There is a gap inside even a well-instrumented dashboard, and a sharp board member will find it. Suppose cycle time drops and rework falls in the two quarters after the AI rollout. That shows performance changed. It does not show AI caused it. Over the same period the team composition shifted, a painful release freeze ended, one service got simpler, review policy tightened, the incident load fell, the product mix moved toward easier work, and two unrelated process improvements landed. Any of those moves cycle time. The board's question is not "did delivery improve." It is "how much of the improvement did the AI investment cause." Instrumentation alone cannot answer that. You need a comparison.
That changes the strongest practical recommendation. Instrument the workflow, but roll AI out in a way that preserves a credible comparison group, so the change has something to be measured against. In practice that means capturing six layers rather than one.
| Layer | What to capture |
|---|---|
| Exposure | Which tasks used AI, which tool, the intensity, and the workflow stage |
| Outcomes | Lead time, throughput, rework, defects, and review burden |
| Segmentation | Repository, task type, complexity, role, and experience |
| Comparison | A randomized or staggered rollout, a matched cohort, or a difference-in-differences baseline |
| Guardrails | Reliability, security, maintainability, and developer experience |
| Economics | Tool cost plus the review and rework cost per accepted production change |
The comparison row is the one most rollouts skip, and it is the one the board's question depends on. A staggered rollout, where teams adopt AI in a deliberate sequence rather than all at once, gives you a before-and-after and a with-and-without at the same time, for very little extra cost. Without it, a more sophisticated dashboard can answer the causal question just as wrongly as the survey did, only with more decimal places.
What to Measure Changes by Role, Not Just at the System Level
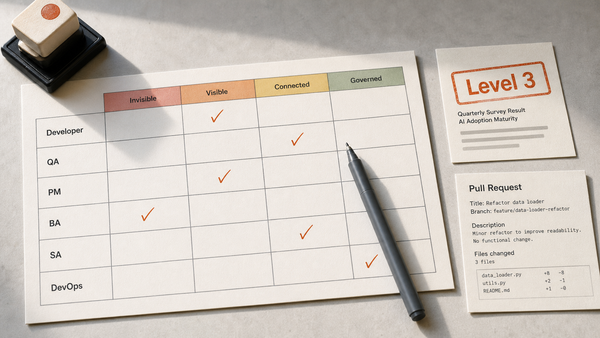
None of this lands as a transformation if it stops at a single org-wide dashboard, because the way AI changes the work is role-specific, and so is the signal that tells you whether it changed for the better. Each delivery role has one artifact-level question worth more than any survey response from the people in that role.
| Role | The survey-grade question (don't rely on it) | The artifact-grade question (instrument it) |
|---|---|---|
| Developer | Does AI make you write code faster? | Did review depth and rework share hold steady or improve as code volume rose? |
| QA | Are you generating more tests with AI? | Did escaped defects fall, or just test volume rise? |
| Product Manager | Are you drafting specs faster? | Did acceptance criteria get sharper, or just get written sooner? |
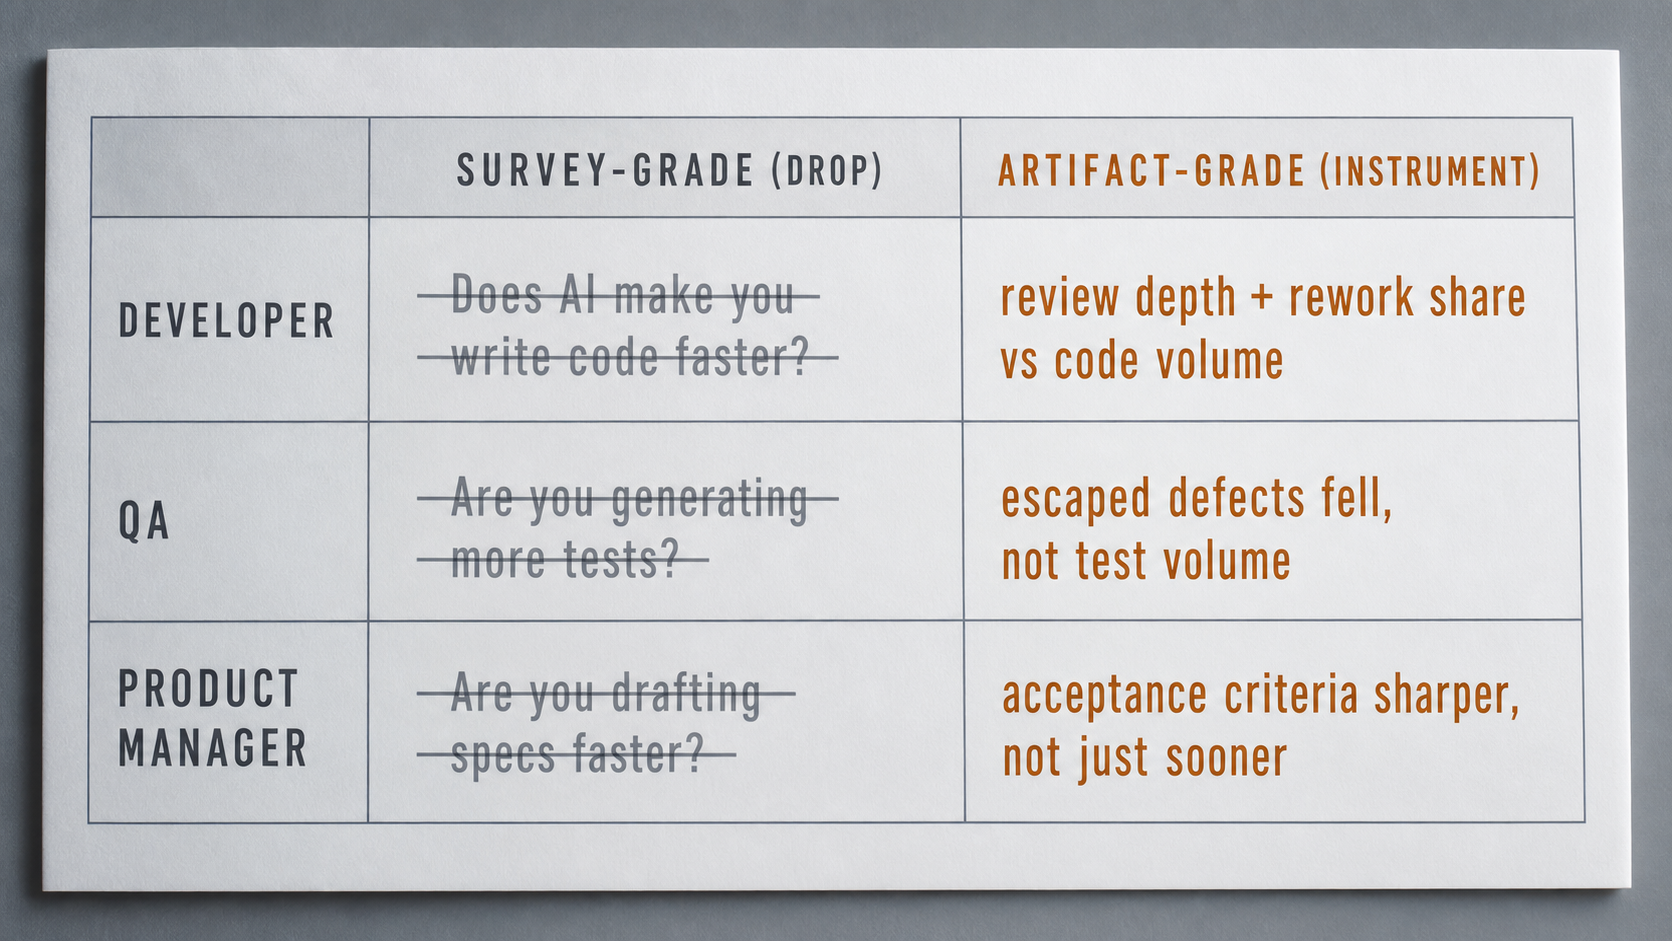
Read down the right-hand column and the pattern is consistent: the artifact-grade question is about what the work became, not how it felt. A developer can tell you little reliable about whether the team got faster; the rework share can, read alongside task mix, review policy, and defect detection. A QA engineer's sense of productivity is not evidence; the escaped-defect trend is. Instrument the right column, weight the left one as context rather than proof, and the role-level picture assembles into a system-level answer the board can actually trust.
Give the Board One Number, With Guardrails
The board asks for one number, and engineering performance cannot be compressed safely into a single unguarded metric, but it can be led by one economic outcome with a small set of guardrails behind it. The primary outcome worth reporting is cost per accepted production change: the tool spend plus the review and rework cost it takes to get one change accepted into production. It captures the thing the survey missed, that AI can move effort around without moving total cost down.
| Primary outcome | Guardrails |
|---|---|
| Cost per accepted production change | Lead time |
| Escaped defects | |
| Rework within 14 to 30 days |
One discipline keeps that number honest: an accepted production change has to be normalized by task type or complexity, or a team improves the metric by quietly choosing easier work. Read with that guardrail, the primary number answers the board's question without inviting the next, obvious gaming move.
This does not mean retire the survey. It means stop asking it to do a job it cannot do. Self-report is still the right instrument for friction, for trust in generated output, for where AI helps and where it hurts, for the work that never shows up in version control, and for why a measured outcome moved. The hierarchy is what matters: use telemetry to measure outcomes, comparisons to estimate how much of the change AI caused, and surveys to explain the mechanism and the human effects. Keep all three. Just stop using the third as proof of the first.
So the honest position is this. Developers can accurately report whether AI reduced their friction, changed their work, or improved their experience. They cannot, through self-report alone, establish whether the delivery system became faster. The perception vs reality gap METR measured is not a reason to lose faith in AI, and it is not a reason to keep polling harder until the survey says something comforting. To answer the board's question, instrument AI exposure and delivery outcomes, preserve a credible comparison group so you can attribute the change, and use surveys to explain the result rather than prove it. The teams that survive the question are not the ones whose developers are most enthusiastic. They are the ones who stopped treating the feeling as evidence and started reading what the work left behind, against a baseline that lets them say how much of it was the AI.
AI Transparency Notice: This article and its accompanying images were created with the assistance of generative AI. The author directed the content, contributed the underlying ideas and analysis, and reviewed the final publication.