DORA 2025: AI Is a Mirror, Not a Lever
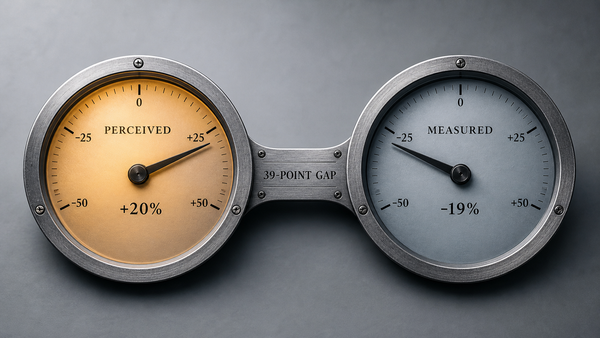
A delivery team turns on AI coding tools. The deploy-frequency line climbs within a quarter. And in that same quarter, the change-fail rate climbs too. DORA 2025 found both numbers rising together in the same teams. AI does not improve a delivery system.
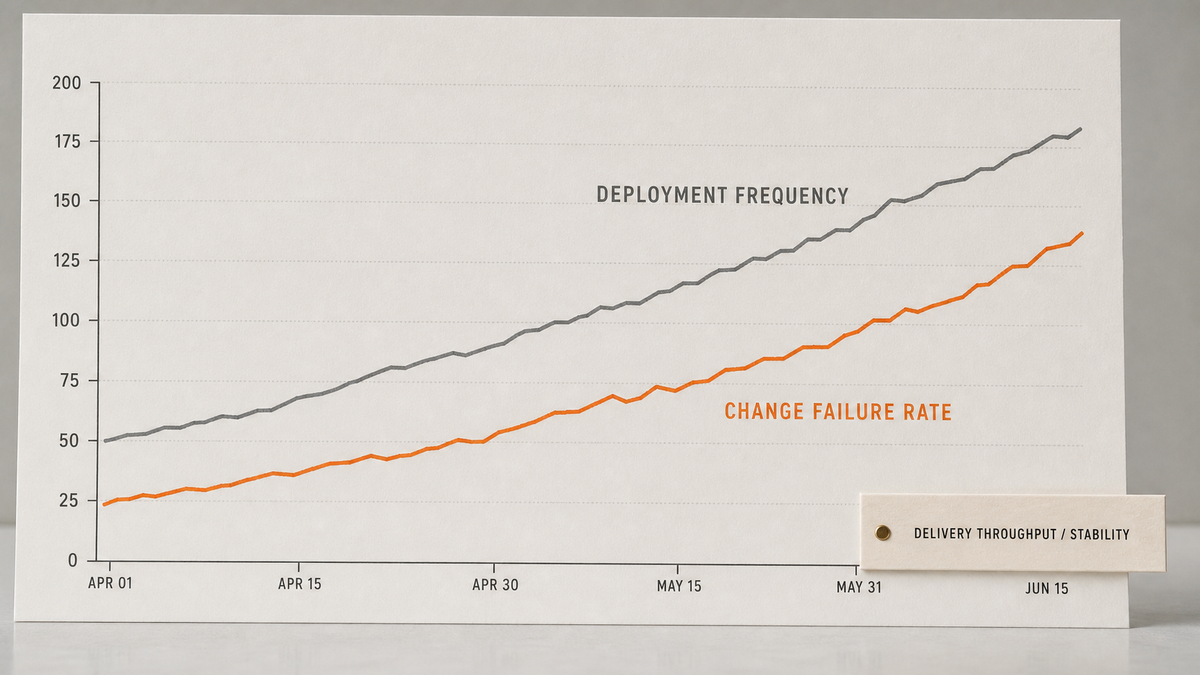
There is a contradiction that shows up in almost every team that turns on AI coding tools. The deploy-frequency line climbs within a quarter. People feel faster. The demos are better. And in that same quarter, the change-fail rate climbs too. More releases reach production, and more of them break something once they get there.
AI does not improve a delivery organization's performance. It amplifies whatever delivery system already exists, raising both throughput and instability in proportion to how disciplined the underlying operating model is.
The usual reading treats that second number as a footnote. The throughput gain is the headline; the instability is "growing pains," a temporary tax that better prompts and a few more guardrails will pay down. That reading is wrong, and why it is wrong is the whole point here. The two numbers are not a win and a side effect. They are one measurement, taken twice.
This is where the lever framing falls apart. A lever is a tool you pull to get more of one thing. If AI were a lever, you would expect the throughput line to rise and the stability line to either hold or improve, because that is what a productivity multiplier does. That is not what the data shows, and it is not what teams report. So the lever framing has to go. AI is not a lever you pull to get more delivery. It is a mirror that reflects the operating system underneath, and it reflects the whole face: the disciplined parts and the undisciplined parts, at the same time, in the same numbers.
Deploy frequency and change-fail rate moved in the same quarter, and that is the finding
The backing for this used to be anecdote. Now it is survey data. DORA's State of AI-Assisted Software Development 2025 found that AI adoption is associated with a rise in deployment frequency and, at the same time, a rise in change failure rate. Throughput went up. Stability went down. The report does not present this as two findings about two unrelated dials. It reads as a single, uncomfortable correlation: the teams shipping more with AI are also the teams breaking more in production.
The mechanism behind that correlation is not mysterious once you name it. AI compresses the cost of producing change. Writing a function, scaffolding a service, drafting a migration, generating a test suite, all of it gets cheaper and faster. But the cost of producing change was never the binding constraint on a healthy delivery system. The binding constraint was the system's capacity to review, test, gate, and absorb that change safely. Compress one side of that equation and leave the other side untouched, and the volume of change now exceeds what the existing review and test discipline could hold. The dam did not get taller. The river got faster.
That is why the two numbers move together rather than apart. Deployment frequency rises because change is cheaper to produce. Change failure rate rises because the same review capacity, the same test coverage, the same deployment gates, and the same rollback discipline are now metabolizing more change per unit of time than they were built to handle. The throughput gain and the stability loss are not a benefit and a cost. They are the upstream and downstream readings of one pipe under more pressure.
The other two DORA metrics tell the same story from a slightly different angle. Lead time for a change tends to fall, because the bottleneck that lead time was measuring, the human effort of producing the change, just got compressed. Time to restore service tends to hold or worsen, because restoring service depends on the parts of the operating model AI did not touch: how good your observability is, how fast you can isolate the failing change, how practiced your rollback is. AI made it cheaper to create the change that caused the incident. It did nothing to make the incident easier to recover. So the throughput-side metrics improve, the stability-side metrics degrade, and a careful read of all four software delivery metrics at once shows the operating model bending under a load it was never re-tuned to carry.
The instability is not evenly distributed, either. It concentrates exactly where the existing discipline was thinnest. A team with a strong review culture sees deploy frequency rise and change-fail rate barely move, because the review function had headroom to absorb more change. A team where review was already a formality sees deploy frequency rise and change-fail rate spike, because there was no headroom to begin with. The AI did not create the weakness. It found it, the way water finds the lowest point, and then it poured more volume through it.
This is where measuring the right thing stops being a slogan and becomes a survival skill. An honest read of software delivery performance does not celebrate the deploy-frequency line and quarantine the change-fail line in a different chart owned by a different team. It reads them as a pair, because they are a pair. The number that tells you how fast you ship and the number that tells you how often you break are both describing the same operating model, just from opposite ends.
A lever multiplies force in one direction, a mirror reflects the whole face
The metaphor matters because it changes what you do next. If AI is a lever, the response to rising instability is to pull harder and smarter: better prompts, more guardrails, a stricter linter, another wrapper. You treat the instability as a defect in how you are using the tool. If AI is a mirror, the response is different. You stop looking at the tool and start looking at what the tool is reflecting, because the instability is not telling you something about the AI. It is telling you something about the operating model the AI just amplified.
Hold the two readings side by side. A lever multiplies force in one direction, which is exactly why the lever framing keeps the throughput number and discards the stability number. It has no language for a tool that makes two things bigger at once. A mirror has no good side and no growing-pains side. It reflects whatever is in front of it, faithfully, including the parts you were hoping it would not show. The change-fail rate rose not because AI is reckless. It rose because the existing review, test, and gating discipline was already operating near its limit, and AI removed the one thing that had been holding the volume of change down: the cost of producing it.
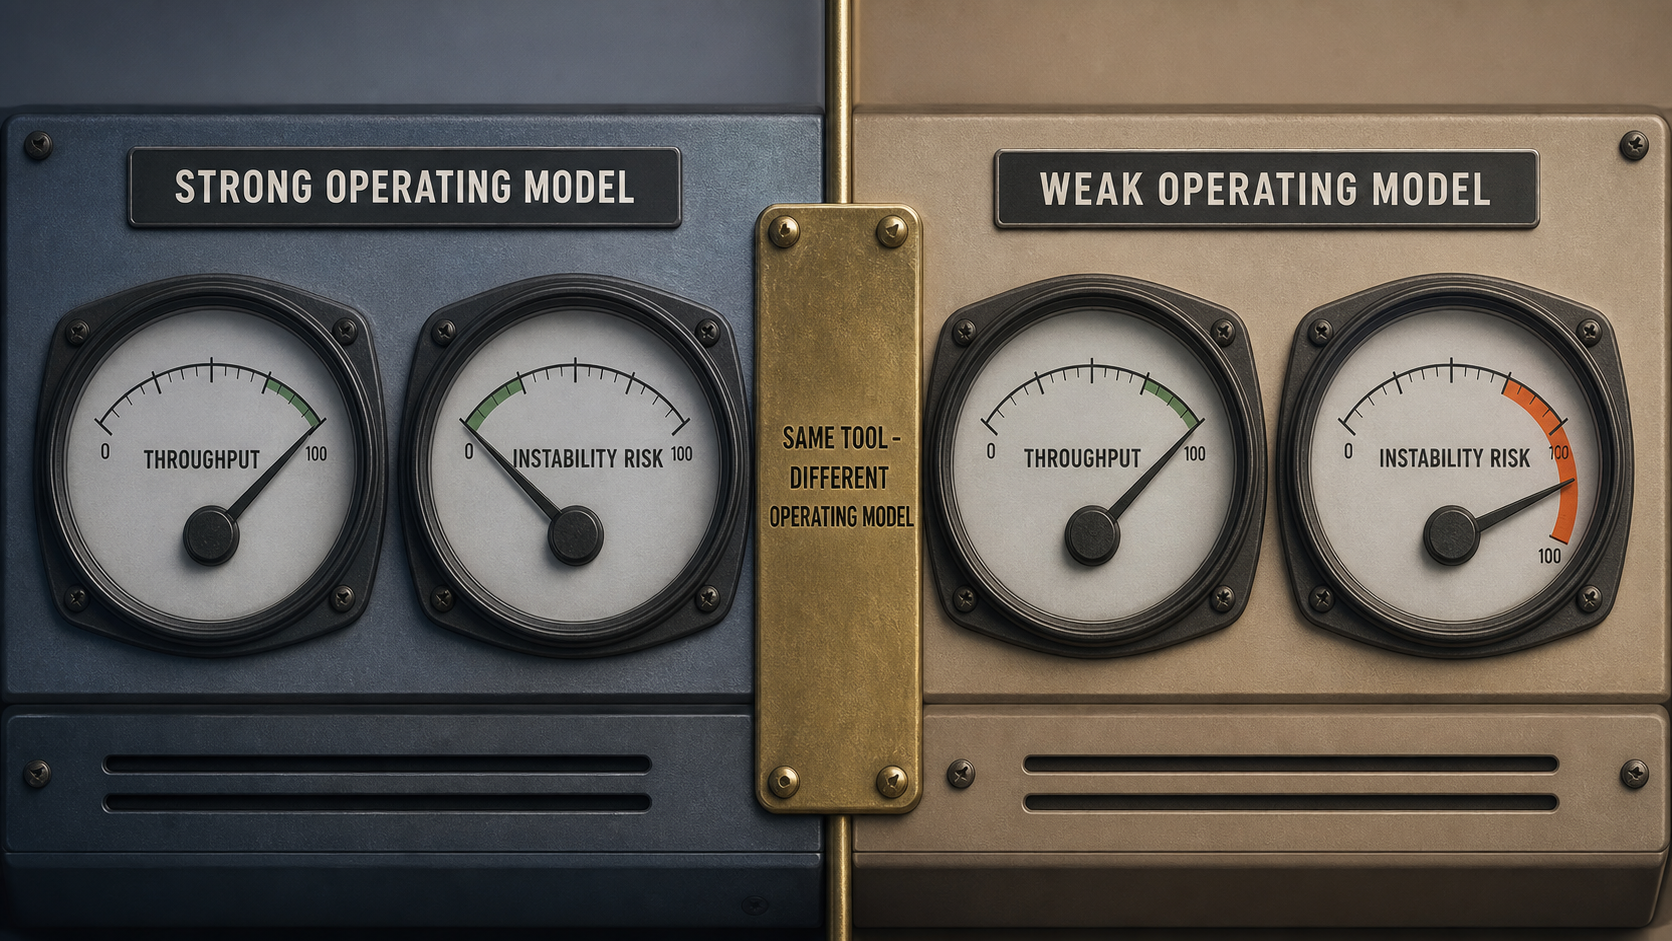
So the same tool produces opposite outcomes depending on the operating model underneath it, and this is the part the consensus reading misses entirely. Where the operating model is strong, where review has real capacity, where test coverage actually exercises the risky paths, where deployment gates are more than a checkbox, and where rollback is a practiced reflex rather than a runbook nobody has read, AI raises throughput and holds stability. The mirror reflects discipline, and discipline scales. Where the operating model is weak, where review is a rubber stamp, where the tests pass because they assert almost nothing, where the deployment gate is a Slack message that says "shipping," and where rollback is a thing people improvise during the incident, AI raises throughput and breaks stability. The mirror reflects the absence of discipline, and that absence scales too.
The tool did not choose which outcome you got. The operating model did. This is the empirical proof layer under a claim that is easy to state and hard to act on: AI transformation is operating-model change, not tool adoption. The DORA finding is what that claim looks like when an industry-wide dataset measures it. The teams that got the good version of AI were not using a better model or a cleverer prompt library. They were running a delivery system that could absorb amplified change without amplifying failure. The teams that got the bad version installed the same tools on top of a system that could not, and the mirror showed them the gap they had been able to ignore while change was still expensive to produce.
The 7 capabilities are a read-before-scale test, not a checklist to complete
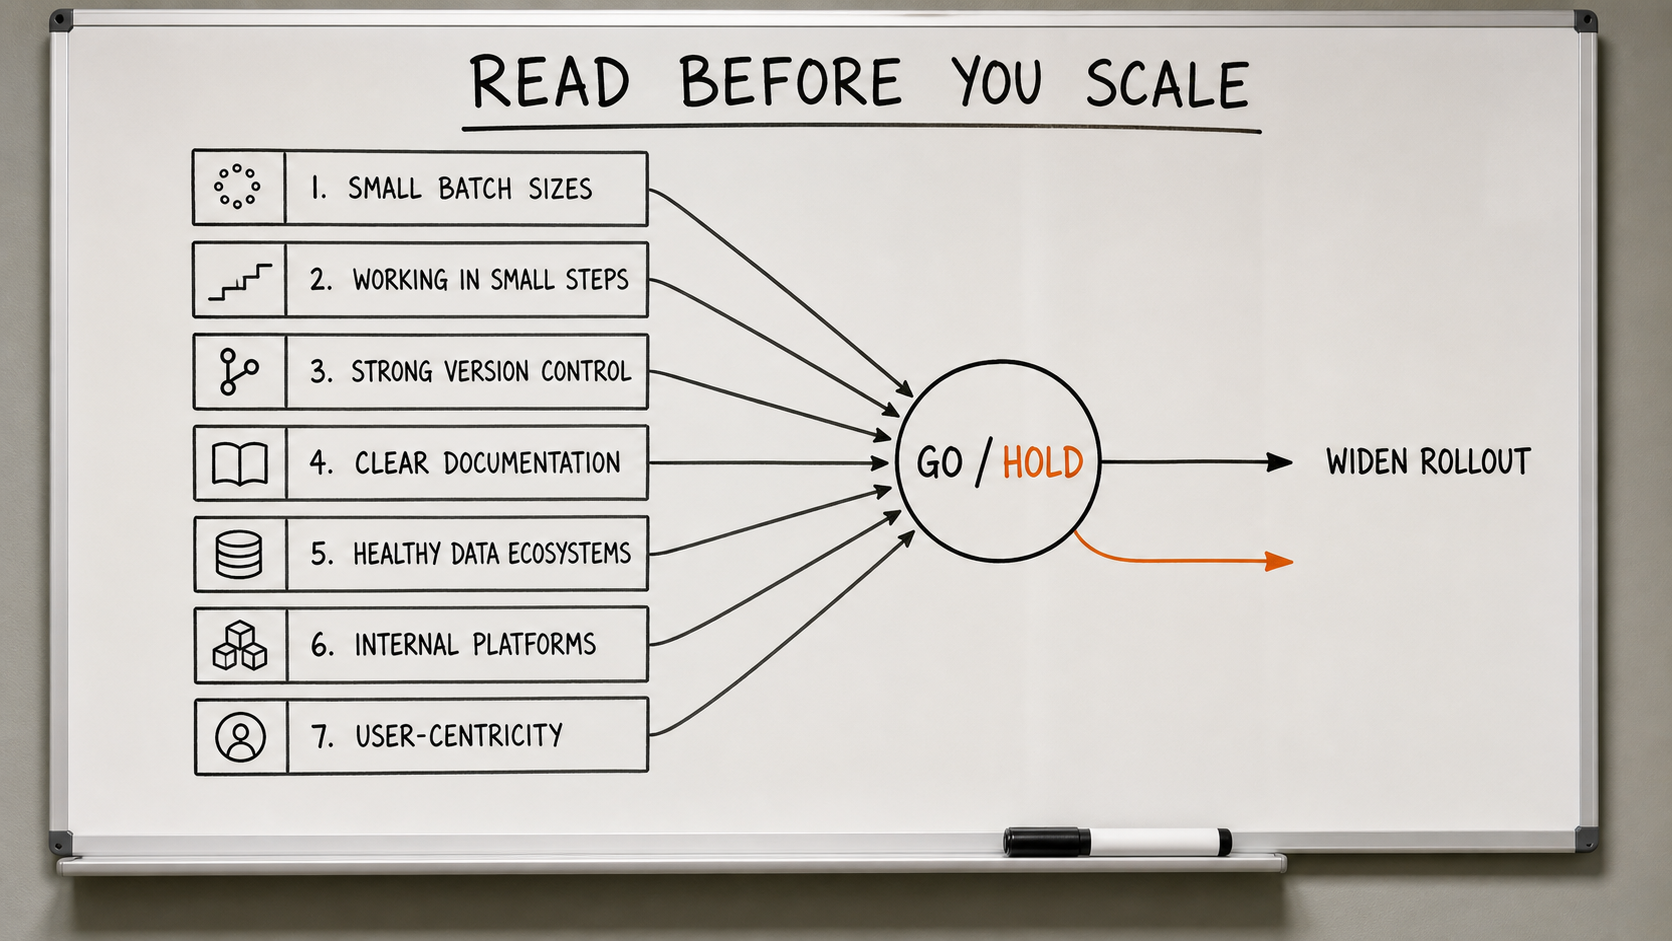
DORA's research has spent more than a decade identifying the capabilities that separate high-performing delivery systems from low-performing ones. Small batch sizes. Clear documentation. Healthy data ecosystems. User-centricity. Internal platforms that reduce friction. Strong version control. The discipline of working in small steps. The temptation is to read that list as a checklist, tick the boxes, and call the operating model ready. That is the wrong instrument for the job.
Read the 7 capabilities as a diagnostic instead. They are what you measure on the operating model before the rollout widens, not after, because AI magnifies whatever is already there. A capability that is strong gets amplified into a stability advantage. A capability that is weak gets amplified into a failure mode. The list is not a to-do. It is a set of dials you read to predict which version of AI you are about to get, and an effective read-before-scale test measures these capabilities before you give the whole org the tool, not in the postmortem after the change-fail rate has already moved.
There is a sequencing claim hiding in that prescription, and it is the part most rollouts get backwards. The default rollout order is: buy the tool, give it to everyone, watch adoption, then react to whatever the metrics do. The read-before-scale order inverts it: read the capability, predict the reflection, gate the rollout, then widen only the surfaces where the operating model can hold the amplified change. That is the difference between funding a transformation and funding an experiment you are running on your own production system. One reads the operating model and decides. The other ships the tool and finds out.
This distinction is operational, not academic, because each capability maps to a specific way the mirror reflects. The same seven dials that DORA found predict delivery performance also predict how AI amplification lands.
| Capability (read it first) | If strong, AI amplifies into | If weak, AI amplifies into |
|---|---|---|
| Small batch sizes | Fast, reviewable changes that stay inside review capacity | A flood of large changes that overruns review and hides defects |
| Working in small steps | Incremental change that is easy to gate and roll back | Big-bang changes where failure is hard to isolate and recover |
| Strong version control | Clean history, safe rollback, traceable change | Unrecoverable states and rollbacks that become incidents |
| Clear documentation | AI-assisted work that follows the real contract and intent | Confidently-wrong output that contradicts undocumented rules |
| Healthy data ecosystems | Generated code and tests grounded in trustworthy data | Amplified errors propagated from bad or stale data |
| Internal platforms | Guardrails and gates that scale with the new volume | Manual, inconsistent gates that buckle under the new volume |
| User-centricity | More throughput aimed at outcomes that matter | More throughput aimed at the wrong work, faster |
Notice what the table is actually saying. None of these rows describe a property of the AI. Every row describes a property of the operating model that the AI then magnifies in one direction or the other. That is the read-before-scale instrument: you look at the dials, you predict the reflection, and you decide whether to widen the rollout or to fix the dial first. The method requires reading the operating model before you scale the tool. It does not require describing what any particular team did, because the prescription is the same regardless of the team: measure the capability, then gate the rollout on what you measured.
An adoption dashboard measures activity, an honest dashboard measures whether the operating model can absorb what AI amplifies
Here is the gap that turns all of this from interesting into expensive. Most AI programs are measured by an adoption dashboard. Seats activated. Prompts run. Percentage of pull requests with AI assistance. Training sessions attended. Those numbers go up reliably, because activity always goes up when you hand people a faster tool. And every one of them tells you nothing about whether your operating model can absorb the amplified throughput without amplifying failure. Adoption is the easiest thing to measure and the least connected to outcome. It is the activity-versus-performance split made concrete: the dashboard proves people are using AI, and proves nothing about whether the delivery system got better or worse.
The failure mode I see in delivery orgs is the funding decision that follows. The board asks for AI ROI. The adoption dashboard is the only instrument in the room, so the deploy-frequency line gets presented as the return, and the change-fail line either does not appear or shows up on a different slide owned by a different function. The program gets funded to scale further on the strength of an activity metric, and the instability that scaling will amplify stays invisible until it surfaces as a string of production incidents two quarters later. The dashboard measured the wrong thing, so the decision optimized the wrong thing.
An honest dashboard does the opposite. It reads throughput and stability together, on the same surface, owned by the same accountability, because they are one signal of the operating model. Deployment frequency and lead time on one side. Change failure rate and time to restore service on the other. The honest dashboard does not let a delivery lead celebrate one number without confronting the other, and it gates the rollout on the capability signal rather than on the adoption signal. Before the tool widens, the read-before-scale test runs, the dials get read, and the rollout either proceeds or waits on the capability that is about to be amplified into a failure. That is what it means to measure the operating model instead of the activity on top of it.
There is a version of this that sounds like fatalism, as if the operating model is fixed and the rollout is doomed to reflect it. It is the opposite. The whole reason to read the mirror is that what it reflects is changeable. The capabilities DORA names are not innate properties of a team. They are the product of governance and standards, of quality gates that actually gate, of role-level redesign that resets what good work means once AI is in the loop. An AI operating model is exactly the layer where those capabilities get built, and building them turns the mirror from a verdict into an instrument. You read it not to accept the reflection but to know which capability to strengthen before the amplification lands on it.
Which lands the whole argument on a single instruction for anyone funding or running AI software development at organizational scale. Before you scale the tool, scale the discipline the tool will amplify. The deploy-frequency gain is real, but it is not the return. It is one half of a reading, and the other half is already moving whether or not your dashboard is showing it to you. AI gave the industry a mirror in 2025. The operating model is the face. Read it before you scale, because the mirror reflects whatever you bring to it, and it reflects the whole of it at once.
AI Transparency Notice: This article and its accompanying images were created with the assistance of generative AI. The author directed the content, contributed the underlying ideas and analysis, and reviewed the final publication.