Story-Point Inflation and the AI Velocity Illusion
The CTO's velocity chart is flat. The team is shipping noticeably bigger scopes per ticket. Both numbers are true, and both come from the same backlog. Story points are a relative unit. AI changed what fits inside one. Reading flat velocity as flat productivity is reading the wrong instrument.

The CTO's velocity chart is flat. The team is shipping noticeably bigger scopes per ticket. Both numbers are true, and both come from the same backlog.
This is the conversation that keeps coming up in AI-enabled delivery orgs, and it is the conversation board reports keep dancing around. Velocity, the headline number, has not moved. Stories that used to take a sprint still take a sprint. The board reads this as flat productivity, looks at the AI tooling spend, and asks the obvious question. The engineers on those same teams are quietly closing tickets they would have called heroic eighteen months ago.
The instinct is to argue about the tools. Whether Copilot is actually helping. Whether the cost is justified. Whether the rollout was botched. None of those arguments touch the actual mechanic, because the actual mechanic lives one layer down, in the measurement system itself.
Story points are a relative unit. A point in February 2024 and a point in May 2026 are not the same unit of work, even though the chart pretends they are. AI changed what fits inside one point. Velocity, the metric, has been silently re-denominated. Reading flat velocity as flat productivity is reading a measurement-system distortion as a productivity signal. It is reading the wrong instrument.
This article is about the instrument problem. Why velocity goes flat while real output rises. What the actual adoption signal looks like once you can see it. And what changes in the operating model when estimation is the first measurement layer AI quietly breaks.
The unit got smaller while the chart kept its old labels
Story points were never meant to measure absolute work. They measure relative size, calibrated against what a team agrees fits in a sprint. The calibration is implicit. It lives in three places: the team's reference stories ("a 3 is like that auth migration last quarter"), the planning conversation ("we always over-commit on 5s, let's cut to 3"), and the sprint review, where the team learns what actually fits.
All three of those calibration mechanisms are tuned to one variable: how much the team can absorb in two weeks. None of them are tuned to "how much code, how many integration points, how many ACs." The point is a relative container. What changes when AI assists implementation is what you can fit inside that container.
In a typical AI-enabled delivery team, a story that used to require building three small adapters, wiring them into an existing flow, writing the unit tests, and updating two docs would historically have been a 5. The shape of that work has not changed. The hands doing it can now produce the three adapters in roughly the time the first one used to take, draft the tests alongside, and the doc updates come close to free. The story still goes in as a 5 because it still feels like a 5 to the engineer. The team's sense of "what fits" recalibrated quietly, in the same direction, story by story.
You can hear this in the planning conversation if you listen for it. The phrase "Copilot will handle the boilerplate" is the audible part of a much larger silent recalibration. Once the team accepts that pattern, they pull in a slightly bigger scope at the same point estimate. Not as a deliberate stretch. Not as a gaming-the-metric move. As an honest read of what now fits.
Velocity tracks points-per-sprint. The points-per-sprint number is the same. The work-per-point number is up. The chart cannot see the second number because nobody is measuring it.
This is the measurement trap. It is not that velocity is wrong. Velocity is doing exactly what it was designed to do: track the team's throughput in its own internal unit. The unit changed. The chart did not.
Four mechanisms by which the unit shrinks
The recalibration is not one move. It is at least four, often happening in parallel, all reinforcing the same direction.
Mechanism 1: acceptance creep. When planning a story, the engineer estimates against their internal model of effort. That model now includes "AI handles the boilerplate." A story that would have been pulled in at a 5 last year, with three adapters, tests, and doc updates, gets pulled in at a 3, because the engineer mentally subtracts the work AI absorbs. The estimate gets smaller. The story does not. The sprint commitment looks healthy. The total work shipped is meaningfully larger than what the points suggest.
Mechanism 2: unbundling-as-absorption. A pre-AI sprint would often have separate tickets for the feature, the refactor that the feature exposes, and the cleanup of an adjacent module that is now in the engineer's working memory. When implementation is cheaper, the engineer absorbs the refactor and the adjacent cleanup into the feature ticket, because it costs them an hour they did not have before. The refactor and the cleanup never get ticketed. They never get counted. They land in the codebase as part of the feature. The PR is larger. The point estimate is the same.
Mechanism 3: refactor inclusion. This is the cousin of mechanism 2, but worth separating because it shows up in the architecture, not the backlog. Pre-AI, second-order cleanup (renaming, restructuring, breaking a long function into three, removing a dead branch) was either deferred indefinitely or scheduled as a "tech debt sprint" that everyone scoped down at planning. With AI assistance, that cleanup costs roughly the time it takes to read the function and confirm the rename. Engineers do it inline, without thinking of it as a separate task. The code quality improvement is real. It is not visible in velocity at all.
Mechanism 4: ambient quality work. Test scaffolding for an edge case the engineer noticed but would not have written tests for. A naming improvement in an adjacent file. An inline doc string that explains a non-obvious decision. A schema migration that was on the backlog as a separate ticket but is one prompt away. None of this is on the original ticket. None of it gets counted. All of it accumulates as ambient quality work the team is now able to do without scoping it.
Add the four mechanisms together and you get a coherent story. Each story carries more delivered surface area than it used to. The point estimate stayed flat because the team's sense of "what fits" did the work of absorbing the change. Velocity, downstream of those estimates, stayed flat too. The board reads a flat number and asks what the AI spend is for. The engineers shipped more than they get credit for.
This is not a complaint. The engineers do not feel cheated. They feel productive, because they are. The measurement layer is the thing that is silently broken.
One more thing about what this is not. The METR 2025 randomized trial found experienced open-source developers using AI tools were roughly nineteen percent slower on real-world tasks while perceiving themselves as roughly twenty percent faster. The 2023 GitHub Copilot RCT (Peng et al.) found roughly fifty-five percent speedup on an isolated greenfield task. Those two results are not in conflict with the mechanism described here. They are measuring different things. The METR study measured time-to-completion on a fixed task. The mechanism here is about what tasks fit at all into a point. A team can be slower per-task in the METR sense and still shipping bigger scopes per point in the estimation sense, because the team's planning system absorbed the change first.
What a real adoption signal looks like
If velocity is blind to scope shift, the signal lives in the scope number itself. The right instrument is some version of scope-per-point: median delivered surface area per estimated point, indexed against a pre-AI baseline.
Surface area is a stand-in for the thing nobody can measure directly. Workable proxies are not abstract. They are countable. Three effective proxies:
- Acceptance criteria count per point. Take the closed stories from the last two sprints. Count the AC bullets on each. Divide by the point estimate. Track the median over time. This is the simplest of the three because ACs are already on the ticket.
- Files touched per point. From the merged PR, count files in the diff. Divide by the point estimate. Track the median. This catches the unbundling and refactor mechanisms, because absorbed cleanup shows up as more files in the PR even when the ticket scope looks the same.
- Integration count per point. For stories that touch external systems, count the distinct integration points (APIs called, queues written to, schemas migrated). Divide by the point estimate. Track the median. This catches the absorption of integration work that would historically have been a separate story.
None of these are perfect. None of them have to be. The point of the metric is not precision. The point is to make visible a shift the velocity number is hiding.
Once you have one of these numbers indexed against a pre-AI baseline, the kind of signal an honest AI adoption dashboard measures, the story you can tell at the board changes shape. Velocity is flat. ACs-per-point is up twenty-eight percent. Files-per-point is up thirty-five percent. Integration count is up twelve percent. Real output is the integral of velocity and scope-per-point, not the velocity number alone. That sentence is defensible. It survives a CFO asking "so are we getting value from this." It survives an engineering peer asking "did you adjust for team-size changes." It survives the more uncomfortable question: "did the team just start padding."
The padding question is worth answering directly. Padding moves estimates up, not the work down. Scope-per-point going up means the work-per-point went up. If the team had been padding, you would see the inverse: same work, larger point. The metric distinguishes the two cases cleanly. That is one of the reasons it survives at the board.
The other reason it survives is that it does not require the team to change how they plan. Scope-per-point reads downstream of planning. The team estimates the same way they always did. The metric infers the shift from what they shipped, not from what they intended.
Three lightweight moves to instrument scope-per-point
Instrumenting this does not require overhauling the planning system. The instrument is parasitic on data the team already produces. Three moves, in order of cost:
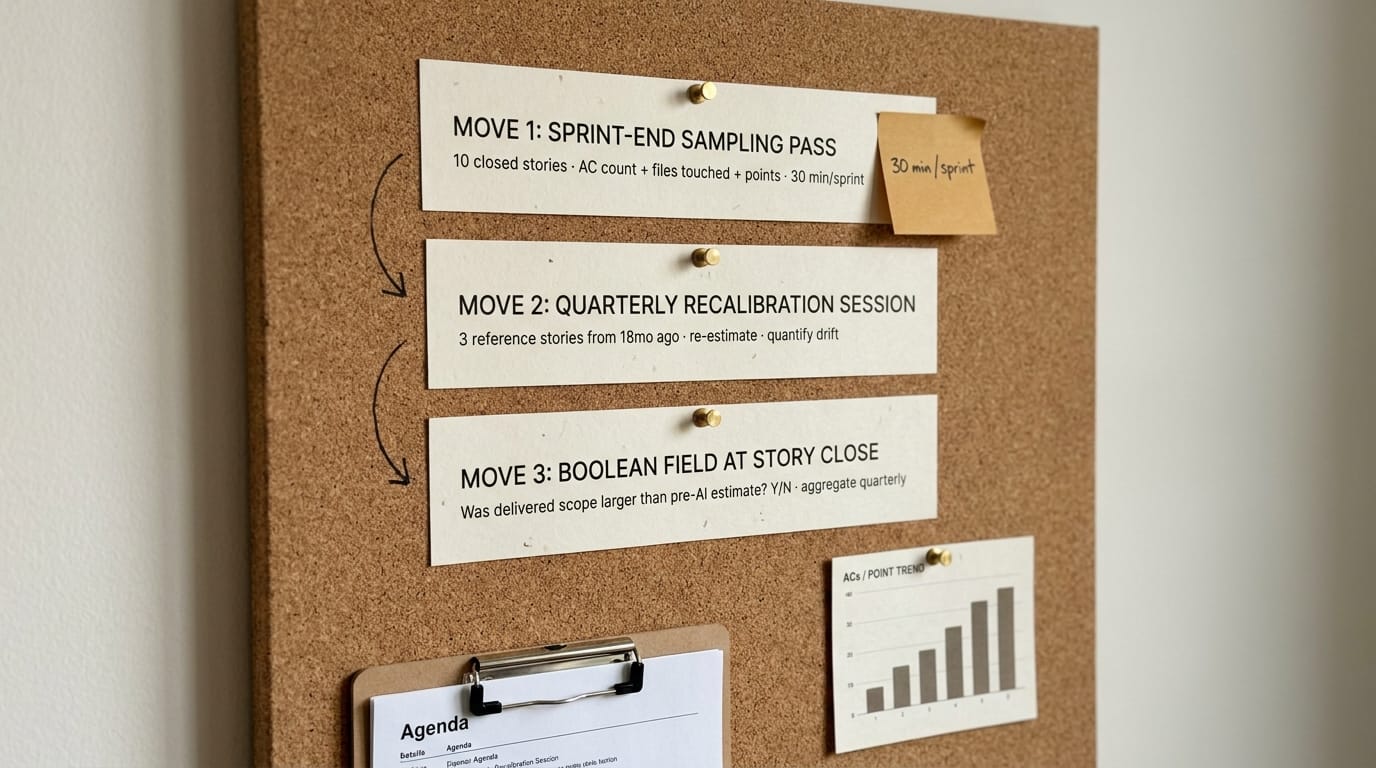
Move 1: a sprint-end sampling pass. At the end of each sprint, sample ten closed stories. For each, record three numbers: the AC count, the files-touched count from the PR, and the point estimate. Compute the medians. Chart them sprint over sprint, indexed against a pre-AI baseline if you have one, or against the team's first three sprints of sampling if you do not. Total cost: thirty minutes per sprint for a team of six engineers. The person doing the sampling does not need to be the team lead. A scrum master, a delivery manager, or an embedded analyst can do it.
The reason this works is that ten stories is enough to make the median stable, and the median is the right summary statistic. Outliers (the one-off heroic story, the trivial cleanup ticket) pull the mean around. The median is steady. Steady is what you need for a board chart.
Move 2: a quarterly recalibration session. Once a quarter, pull three reference stories from eighteen months ago, closed stories the senior engineers remember well. Re-estimate them against current capability. Compare the new estimate to the original. Quantify the drift. A story that was a 5 in late 2024 and would now go in as a 3 is a forty percent drift in the unit. Aggregate across the three stories. This gives you a directly observed estimate of how much the unit itself has changed.
The recalibration session also surfaces the qualitative parts of the shift. The seniors will name the things that used to be hard and are now near-free, the things that used to be quick and have not changed, and the things that have gotten worse. The qualitative output is as useful as the numeric drift estimate when defending the metric at the board.
Move 3: a single boolean field at story close. Add one field to the ticket-close workflow: "was the delivered scope larger than you would have estimated for this story pre-AI? Yes/No." Aggregate quarterly. The number itself is fuzzy. It depends on the engineer's memory of pre-AI estimation. But the trend is durable. A team where the percentage rises sprint over sprint is a team that is feeling the unit shrink in real time. A team where the percentage is flat near zero is either pre-adoption or has not yet hit a maturity where the absorption mechanisms fire.
The three moves stack. Move 1 gives you the chart. Move 2 gives you the recalibration anchor. Move 3 gives you the leading indicator. None of them require changing how the team plans, who attends standup, or what the sprint review looks like. The planning system stays intact. The measurement system catches up.
The board readout that holds up
A flat velocity number is, on its own, indefensible at the board. It looks like AI spend with no return. The CTO trying to defend it without a second number is in a losing argument from sentence one.
The readout that holds up has three parts. First, name the flat number plainly. "Velocity, our headline throughput metric, is unchanged over the last four sprints." Do not soften it. Do not bury it. Do not promise it will move next quarter. The board is going to ask about it anyway.
Second, name the unit shift and quantify it. "Scope-per-point, measured by median acceptance criteria per point indexed against H2 2024, is up twenty-eight percent. Files-touched-per-point is up thirty-five percent. Both numbers are sampled from ten stories per sprint, methodology in the appendix." The appendix part matters. A number whose methodology is one paragraph at the back of the deck is a number the board will defend with you when the auditor asks.
Third, name the implication. "Real delivered output is the integral of velocity and scope-per-point, not velocity alone. The team is shipping meaningfully more delivered scope per sprint than the velocity number suggests, and the AI spend is the proximate cause." Land it there. Do not promise that velocity will go up next quarter. It will not. Promising it will is how the metric loses credibility a quarter later.
The board readout works because it does the thing board readouts have to do: it makes the flat number legible. The CFO is not asking why velocity is flat to be cruel. The CFO is asking because the chart in front of them does not match the AI line item. The scope-per-point number reconciles the two. After it lands, the conversation moves from "why are we spending this" to "how do we keep widening the scope-per-point gap." That second conversation is the one the operating model actually needs.
One more thing belongs in the readout: name the limits of the metric. Scope-per-point is a proxy. It does not capture code quality, defect rate, time-to-recovery, or the quality of the architectural decisions inside those PRs. It captures one dimension of the shift. Naming the limit at the board increases the metric's credibility, not the other way around. Boards trust operators who name what their numbers cannot see.
What this implies for the operating model
Estimation is the first measurement layer AI breaks. It is not the last. Once the unit silently changes, downstream systems start to drift in similar ways.
Roadmap economics is the next one to go. Roadmaps are built on rough scope-to-quarter mapping: this initiative is "a quarter of work," that one is "six weeks." Those mappings were calibrated on the same implicit unit as the story-point estimate. When the unit shrinks, the quarter-of-work becomes six weeks, but the planning system still rounds in quarters. Teams finish ahead and either get pulled into a new initiative that was not planned, or they idle, or they spend the slack on quality work that does not show up anywhere. Each option has costs. None of them are the cost the roadmap actually budgeted for.
Specs are the next layer to feel the strain. When implementation is cheap, the spec becomes the bottleneck. Stories with unclear acceptance criteria used to bottleneck on the implementation. The engineer would build something, the PM would clarify, the engineer would rebuild, and the friction was visible. With AI assistance, the engineer just builds whatever is plausible from the ambiguous spec, faster. The clarification cost moves into review, into rework, into the conversations after the PR is open. Teams that do not invest in spec quality upstream pay the cost downstream, and the cost is no longer visible as "stalled tickets." It is visible as "rework cycles" and "PRs that bounce twice before merging." This is the framing that A016 walked through under the spec-driven-development lens. The estimation layer is the upstream signal of the same shift.
Role boundaries shift next. The PM who used to write 3-AC stories and let the team flesh them out now has to write 8-AC stories to keep the team from absorbing scope that was not intended. The SA who used to be consulted at design time now has to be embedded in story refinement to catch the cross-cutting integration work that engineers are silently absorbing. The QA who used to test against AC count now has to test against actual surface area, which is no longer a stable proxy for the AC count. None of these are tool problems. They are role-redesign problems, downstream of the same shrinking unit.
The L0–L4 maturity model holds up well as a lens here. At L1 and L2, the absorption mechanisms barely fire. Teams are using AI as a typing assistant. At L3, where engineers are running multi-step agentic flows and treating the AI as a junior collaborator, the scope absorption becomes meaningful. At L4, where the team operates as a fully AI-native delivery group, the scope-per-point shift is a defining feature of the team, not a side effect. The instrument should fire most strongly at L3 and L4. If it does not, the maturity claim itself is suspect.
The operating-model implication is the one the board actually needs to hear: the measurement system has to catch up to the implementation system, not the other way around. The team got better. The chart did not. Fixing that gap is an operating-model question, about what gets measured, how it gets reported, and how roadmap commitments translate to scope. It is not a tooling question.
What to change about how delivery is measured
The reader-organization implication is simple and not easy. Stop reading flat velocity as flat productivity. Add one scope-per-point proxy to the sprint review. Run the quarterly recalibration. Watch the board readout shift from defending the AI line item to widening the scope-per-point gap.
The harder implication: every other delivery metric calibrated on the implicit pre-AI unit is going to drift in the same direction over the next eighteen months. Time-to-merge, throughput, lead time, cycle time. Each was calibrated against a quiet assumption about what fits inside a unit of work. The assumption is no longer stable. The measurement system has to catch up. The teams that catch up first are the ones whose board readouts make sense by the end of 2026. The teams that do not will keep arguing about tool spend while the metric drift compounds underneath them.
Velocity did not lie. It told the truth about points-per-sprint. The unit changed. The chart kept its old labels. That is the whole article in two sentences. What you do about it is an operating-model decision, not a measurement one.
AI Transparency Notice: This article and its accompanying images were created with the assistance of generative AI. The author directed the content, contributed the underlying ideas and analysis, and reviewed the final publication.